Do you have an altimeter on the dashboard of your car to gauge your altitude? Not likely. This metric doesn’t fit the application.
In his first State of the State address last Wednesday Governor Snyder announced that the Michigan government will have a dashboard to gauge progress in different areas that will be available online for all of us to view. In  general, I like this idea. But it’s important not to fall into a “one-metric-fits-all” mentality.
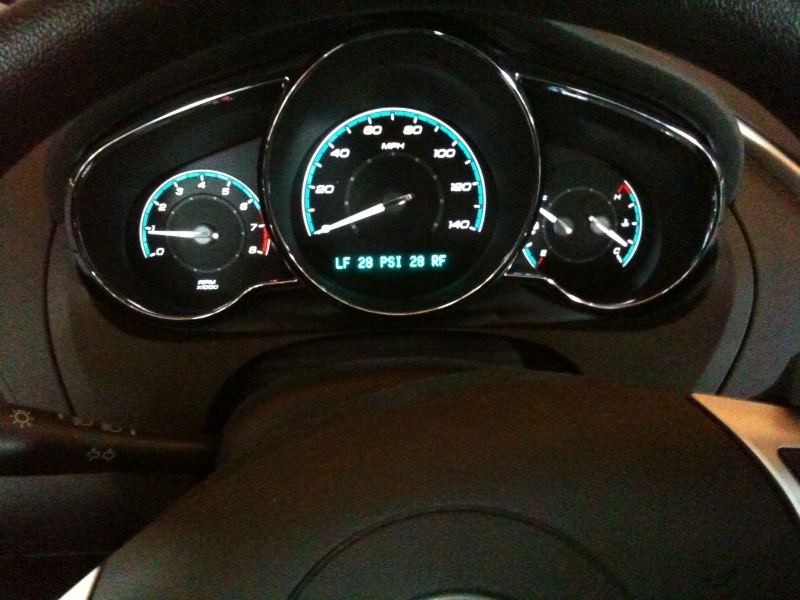
A dashboard has gauges to show the status of something. The dashboard in a car has gauges to show speed, mileage, engine temperature, etc. Mine even shows tire pressure in each tire.
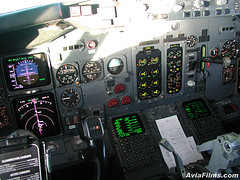
 The dashboard in an airplane (known as a cockpit) has a different set of gauges, adapted to air travel, to show air speed, altitude, pitch, flaps up or down, the status of each engine, etc.
In the corporate world computer software displays charts and graphs to let the viewer gauge the status of things. And the metrics used are the measurements selected to show the status.
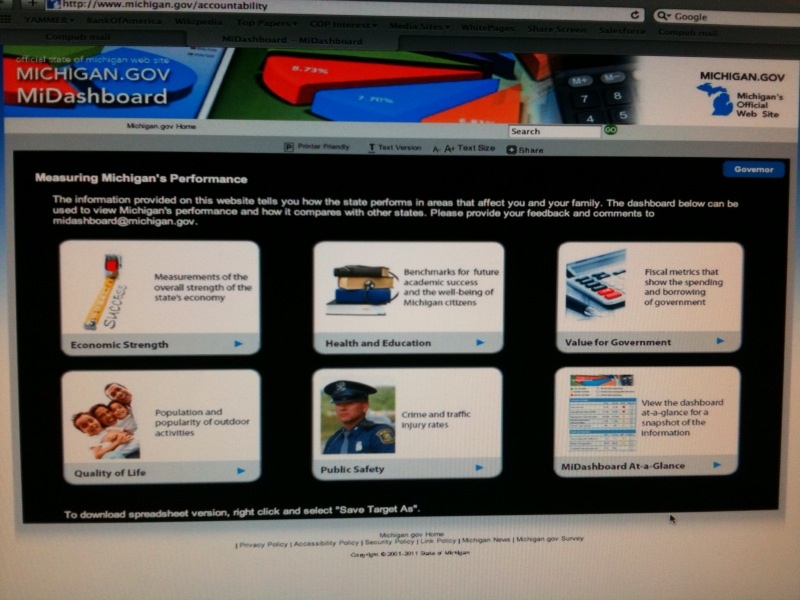
 The Michigan “MiDashboard” shows progress in the areas of economic strength, health and education, value for government, quality of life, and public safety. Our government will work to make improvement in these areas.
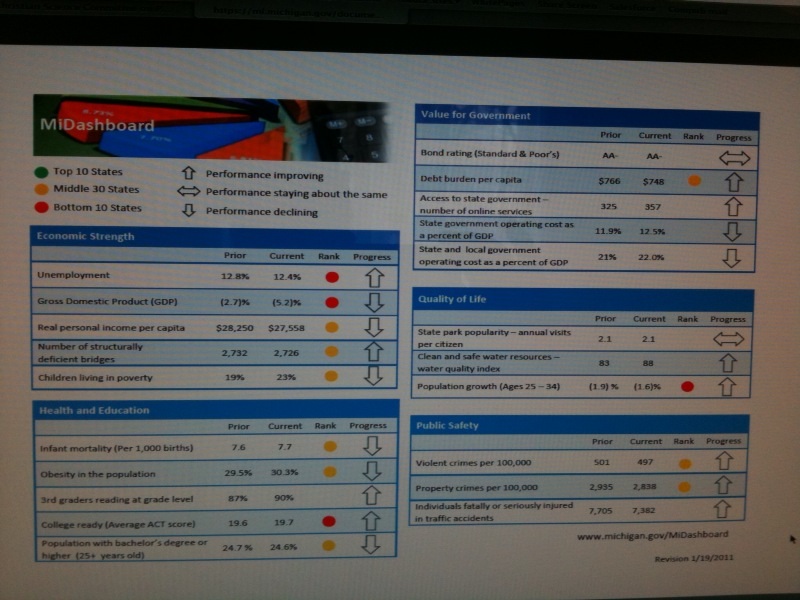
Here’s where metrics are important. For example, the metrics used here to  show progress in the area of health are measurements of infant mortality and obesity in the population. The MiDashboard shows that, in these areas, while Michigan is in the 30 middle states in the country it is worse than the nation-wide average and our performance is currently declining. So MiDashboard indicates that these are important areas in which to seek improvement.
But remember the question at the beginning? Do you have an altimeter on the dashboard of your car to gauge your altitude? Again, the metrics selected are important. In the area of health, a measurement of obesity is only one factor. If, for example, we had zero percent of our population falling into the category of “obese” but had a number of other health problems in our population we would see a fantastic status for “health” on our dashboard despite an actual overall poor performance in this area.
A one-size-fits-all or one-metric-fits-all or one-metric-says-it-all approach can be quite misleading.
I’d like to ask you to think about this a bit. And by all means feel free to leave a comment to share your thoughts. I’m going to continue this discussion in my blog post next week. In the mean time, take a first look at the new Michigan MiDashboard.


Pingback: Dashboards, Metrics & Health | Christian Science in Michigan